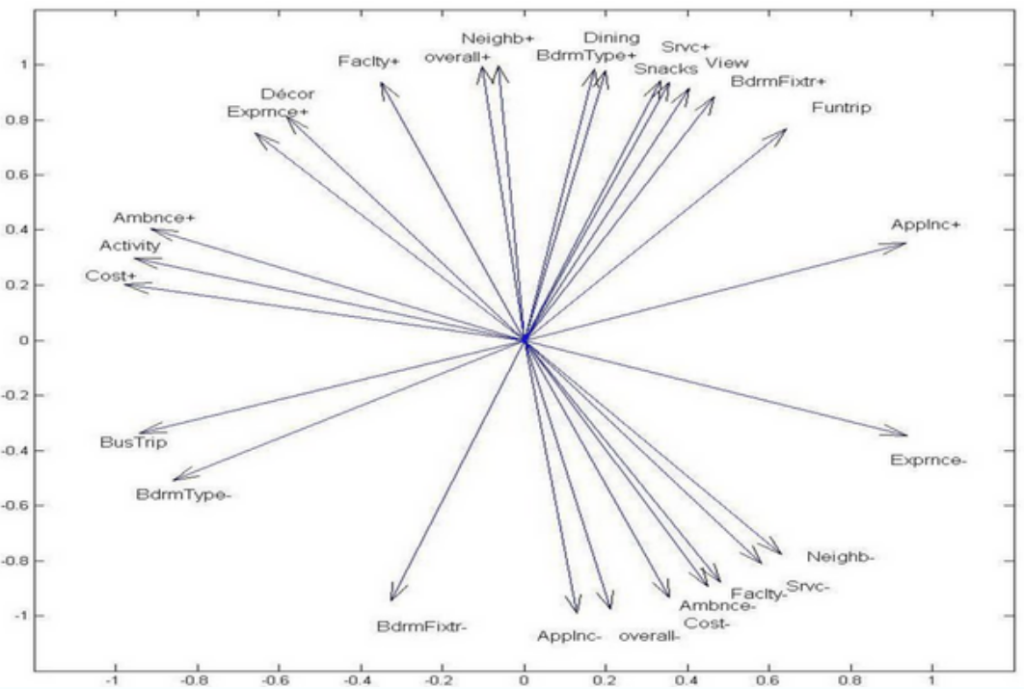
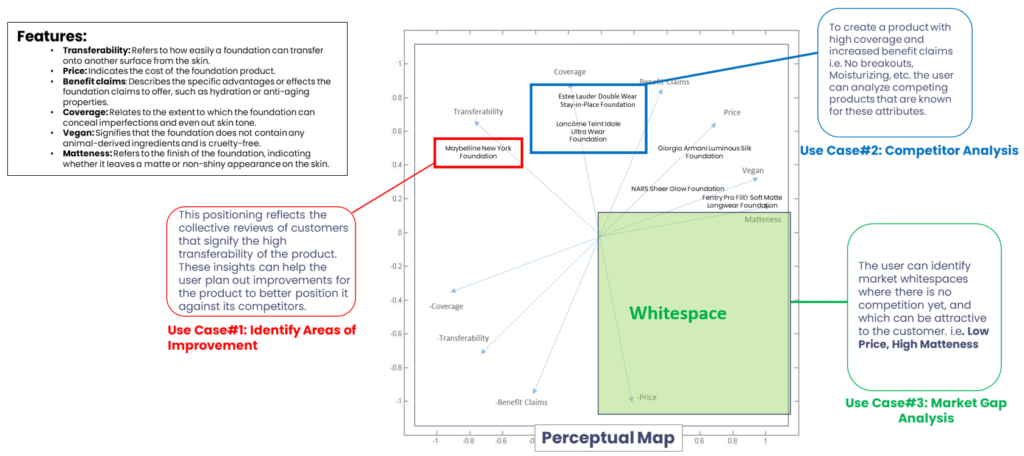
Quadrant chart is commonly used to understand the competitive product landscape. It uses two axes X and Y which are usually two meaningful product features e.g. Location and Food Quality of a hotel. But what if we want to evaluate hotels in Manhattan against 12 different features. You need X, Y, Z, U, V, W…. axes to visualize the positioning of a hotel against its competitors. The question is, “How do we compress a 12 dimensional vector space to visualize it on a 2D screen?”

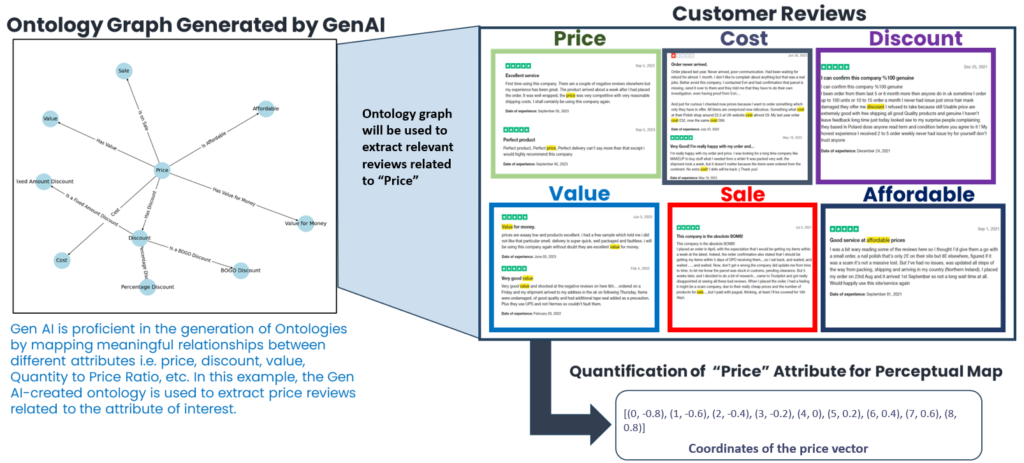
This compression should maintain the distance between hotels in such a way that the most dissimilar hotels should actually be displayed farthest apart and vice versa. Large FMCG companies today are using deep learning and LLMs to process online customer review data, and find the direction of each feature in a compressed 2D space that actually represent perceptual map of customers. This 12D to 2D map conversion allows analysts, product innovators and branding executives to evaluate their product positioning in the customer’s perception along all criteria at once.


